OVERVIEW
CHANGES AND FLOWS
BREAKS
GROWTH RATES
GROWTH RATE FORMULAE
USER INTERPRETATION
OVERVIEW
In monetary and financial statistics, a distinction is made between changes in amounts outstanding of financial instruments that are due to transactions, and those that are due to other changes in assets. This distinction forms a standard part of the international statistical guidelines, such as the European System of National and Regional Accounts 1995 (ESA 95)1, where the latter category comprises ‘other changes in the volume of assets and liabilities’, and 'holding gains and losses'. For convenience, these categories are combined in these explanatory notes and referred to as other changes in the value of assets (OCVA).
Transactions means the net change in balances over a reporting period that is attributable to the economic or financial behaviour of households, businesses or other entities in the sectoral definition – e.g. putting more money into a savings account, or repaying a business loan. Other changes in the value of assets (OCVA) means the effects of changes in definitions, statistical re-classifications, write-offs, revaluation effects and such like. In accounting terms:
Closing balance = opening balance + transactions + other changes in value (OCVA)
For typical monetary aggregate series, the Bank of England publishes data on the amount outstanding ('levels'), the change in amount outstanding due to transactions, and growth rates. Series identifiers and table headings mainly use the terminology: Monthly changes of... to refer to transactions, and in fact the term transactions is not typically employed. Flows and net flows are equivalent terms which are also used. Each of these expressions should be understood to be synonymous with transactions.
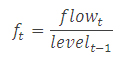
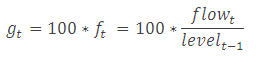
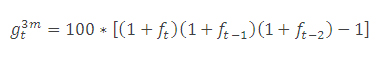
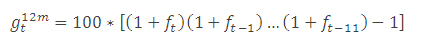
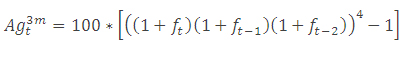
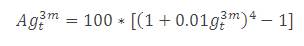
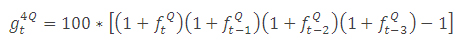
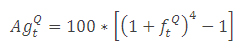
For growth rates, the view is taken that these are generally more meaningful once the inpacts of other changes in the value of assets (OCVA) have been removed from the calculation, so that they are not distorted by breaks in series. Growth rates are therefore calculated from flows and previous period amounts outstanding. The one-month growth rate is calculated as the flow during the month expressed as a percentage of the amount outstanding at the previous month. Longer period growth rates, e.g. 3-month and 12-month growth rates, are calculated by compounding the one-month growth rates of the current and preceding months.
It is important to appreciate that this calculation of growth rates can differ from the alternative calculation derived from amounts outstanding data for the current and original periods. Differences between these methods of will arise because of the exclusion of OCVA effects.
Table 1: Terminology and definitions
| Amount outstanding |
Closing balance |
| Previous amount outstanding |
Opening balance |
| Flow (or ‘change’) |
Transactions |
| Growth rate, over a single period |
= Transactions / opening balance |
| Growth rate, over multiple periods, e.g. 12-month rate |
= Single-period growth rates, compounded |
| Break |
Other changes in assets |
CHANGES AND FLOWS
The accounting relationship between opening and closing balances, transactions and other changes in value of assets (OCVA) is expressed as follows:
Closing balance = opening balance + transactions + other changes in value (OCVA)
Broadly speaking, transactions (or ‘flows’) are changes in balances that arise from underlying economic behaviour – e.g. an increase in savings if income has exceeded expenditure. In contrast, ‘other changes in value’ (OCVA) are those changes in balances that have definitional, accounting or other special explanations such as a change in reporting population.
If there are no OCVA effects, then the flow is simply the difference in amounts outstanding over the reporting period. In order to take account of a known OCVA effect, an offsetting adjustment term is applied to the calculation of the flow. The OCVA adjustment term therefore represents the negative of the OCVA effect. Such adjustments are normally applied manually, although in the case of currency revaluation effects they can be automated as a function of data on exchange rates and data or estimates of the currency composition of assets and liabilities.
Flows data should therefore be understood to be imputed data, and are constructed as:
Transactions (‘flow’) = closing balance - opening balance + OCVA adjustment
There are a number of examples of OCVA effects for which adjustments are made:
- Changes in the reporting population. ‘Joiner’ or ‘leaver’ adjustments can be made in respect of institutions which become part of, or cease to be part of, the MFI sector during the reporting period.
Whether an adjustment is actually applied will depend on a judgement of whether the impact on the reported data represents mainly ‘transactions’ or definitional effects. For instance, the opening of a newly authorised branch or subsidiary of a foreign bank in the UK would not normally require an adjustment, as it would be expected to be competing for banking business with existing institutions. On the other hand, the authorisation as an MFI of an institution previously classified as an ‘other financial corporation’ (OFC), probably would require an adjustment, as it would be presumed to bringing an existing stock of financial balances into the reported data for the first time.
- Classification changes. Amounts outstanding of sectoral balances may change as a result of classification changes reflecting any updated sectoral classification guidance produced by ONS.
- Foreign currency revaluation effects. The sterling value of amounts outstanding denominated in foreign currency will vary with exchange rate movements: such changes are ‘net holding gains or losses’ in ESA 95, and are treated here as OCVA. Adjustments are made in order to remove the estimated effect on the sterling value of reported items that are due to movements in exchange rates, where this information is available.
- Write-offs. Amounts of balances written off are treated as OCVA effects. Write-off adjustments are calculated from quarterly data on write-offs, which are reported in Form WO.
- Miscellaneous other causes. OCVA effects may be recognised and adjusted for on the basis of information provided by reporting institutions. One important case can occur when financial balances move out of the reporting population, for example if a bank securitises assets to a non-UK SPV. Other examples include: non-foreign currency revaluations of MFI assets; correction of long-term misclassification errors, if it is impractical to correct all corresponding intermediate flows; definitional changes; initial accounting effects of an institution’s restructuring.
BREAKS
Breaks (or
breaks in series) means the impact of OCVA effects on amounts outstanding.
Break adjustment means the construction of modified amounts outstanding data series that reflect the application of OCVA adjustments.
See:
Break-adjusted levels data
Other changes in the value of assets (OCVA) effects are removed from transactions (flows) measures, and also from growth rate calculations (see below), in order to maintain the consistency of these series over time. A consequence of this practice, therefore, is that if a data series is subject to OCVA effects, then amounts outstanding will not directly reconcile to the transactions and growth rates for the data series.
Amounts outstanding data reflect the data
before the application of any break adjustments.
Quantitative information on specific breaks in data series is provided in the form of table footnotes. The incidence of breaks in the monetary data aggregates increased considerably during the 1990s and 2000s, primarily as a result of the growth in securitisation during these periods. Whereas at one time breaks in series were quite rare, in more recent times they became much more commonplace. Many footnotes relate to breaks of a comparatively small magnitude.
GROWTH RATES
The growth rate of a Bank of England data series is defined as the percentage rate of increase or decrease resulting from transactions (flows) in the period. The growth rate for a single period (a month or a quarter, depending on periodicity) is calculated by dividing the flow for the period by the level at the preceding period. Longer-term growth rates are calculated by compounding the successive single-period growth rates, not by dividing the flow for these longer periods by the original opening level.
It is important to appreciate that this definition will differ from calculations of growth rates derived solely from current and preceding period data on amounts outstanding.
GROWTH RATE FORMULAE
The following formulae illustrate how percentage growth rates in period t are calculated in terms of flows and amounts outstanding in period t or preceding periods t-1, etc., where t can refer to months or quarters.
The key definition is the single period (one-month or one-quarter) growth rate. Multiple period growth rates, such as the 12-month growth rate, are defined as the compounded single-period growth rates for each of the preceding periods.
The starting point is the one-month (or one-quarter) fractional growth rate:
One-month (or one-quarter) growth rate, %:
Three-month growth rate, %:
Three-month annualised growth rate:
For data series which are available only quarterly, one-quarter and four-quarter growth rates are defined in the same manner as above, in terms of the one-quarter fractional growth rate.
Four-quarter growth rate, %:
Annualised one-quarter growth rate, %:
However, where there exist both quarterly and monthly versions of the same data series, following a change in practice in April 2007, quarterly growth rates of such series are now normally defined to be equivalent to the three-month growth rates as defined above. 2
To summarise, the presumption in these definitions is that users typically require data for flows and growth rates that are calculated after the exclusion of the effects of other changes in value (OCVA). This would be appropriate for users conducting short-term economic analyses of the data, or for users running monthly or quarterly forecasting models. The focus in these requirements is likely to be on shorter term changes reflecting economic factors, i.e. the transactions-based data. Such users are advised to consider using break-adjusted amounts outstanding data, rather than published (non-break adjusted) amounts outstanding data, when updating their datasets of amounts outstanding data. This applies both to seasonally adjusted and non-seasonally adjusted data series, since seasonally adjusted series are constructed so as to retain the break effects present in the non-seasonally adjusted data.
However, this advice need not represent a universal prescription. For example there may be users who are interested only in snapshots at particular periods of time of amounts outstanding, in longer-term comparisons of financial balances, or in changes over time in levels data inclusive of OCVA effects – i.e. without regard to the distinction between ‘transactions’ and other effects. It is open to users to compute changes and growth rates of amounts outstanding directly from these data, without making allowance for breaks in series, if they consider that this would more suitably serve their requirements.