Economic growth matters. High growth rates, are important for improving people’s living standards. But what do we know about the history of economic growth?
What was GDP growth in 1,000 BC?
Gross domestic product or GDP is a measure of the size of a country’s economy. When GDP goes up, the economy is growing: the total value of all the goods and services being produced is going up.
In the UK and many other countries, data for GDP have only been collected after World War II. But using other sources of data, historians can make an informed guess about the growth of the world economy going a long way back.
And what they found is surprising: ‘economic growth’, it turns out, is quite a new thing.
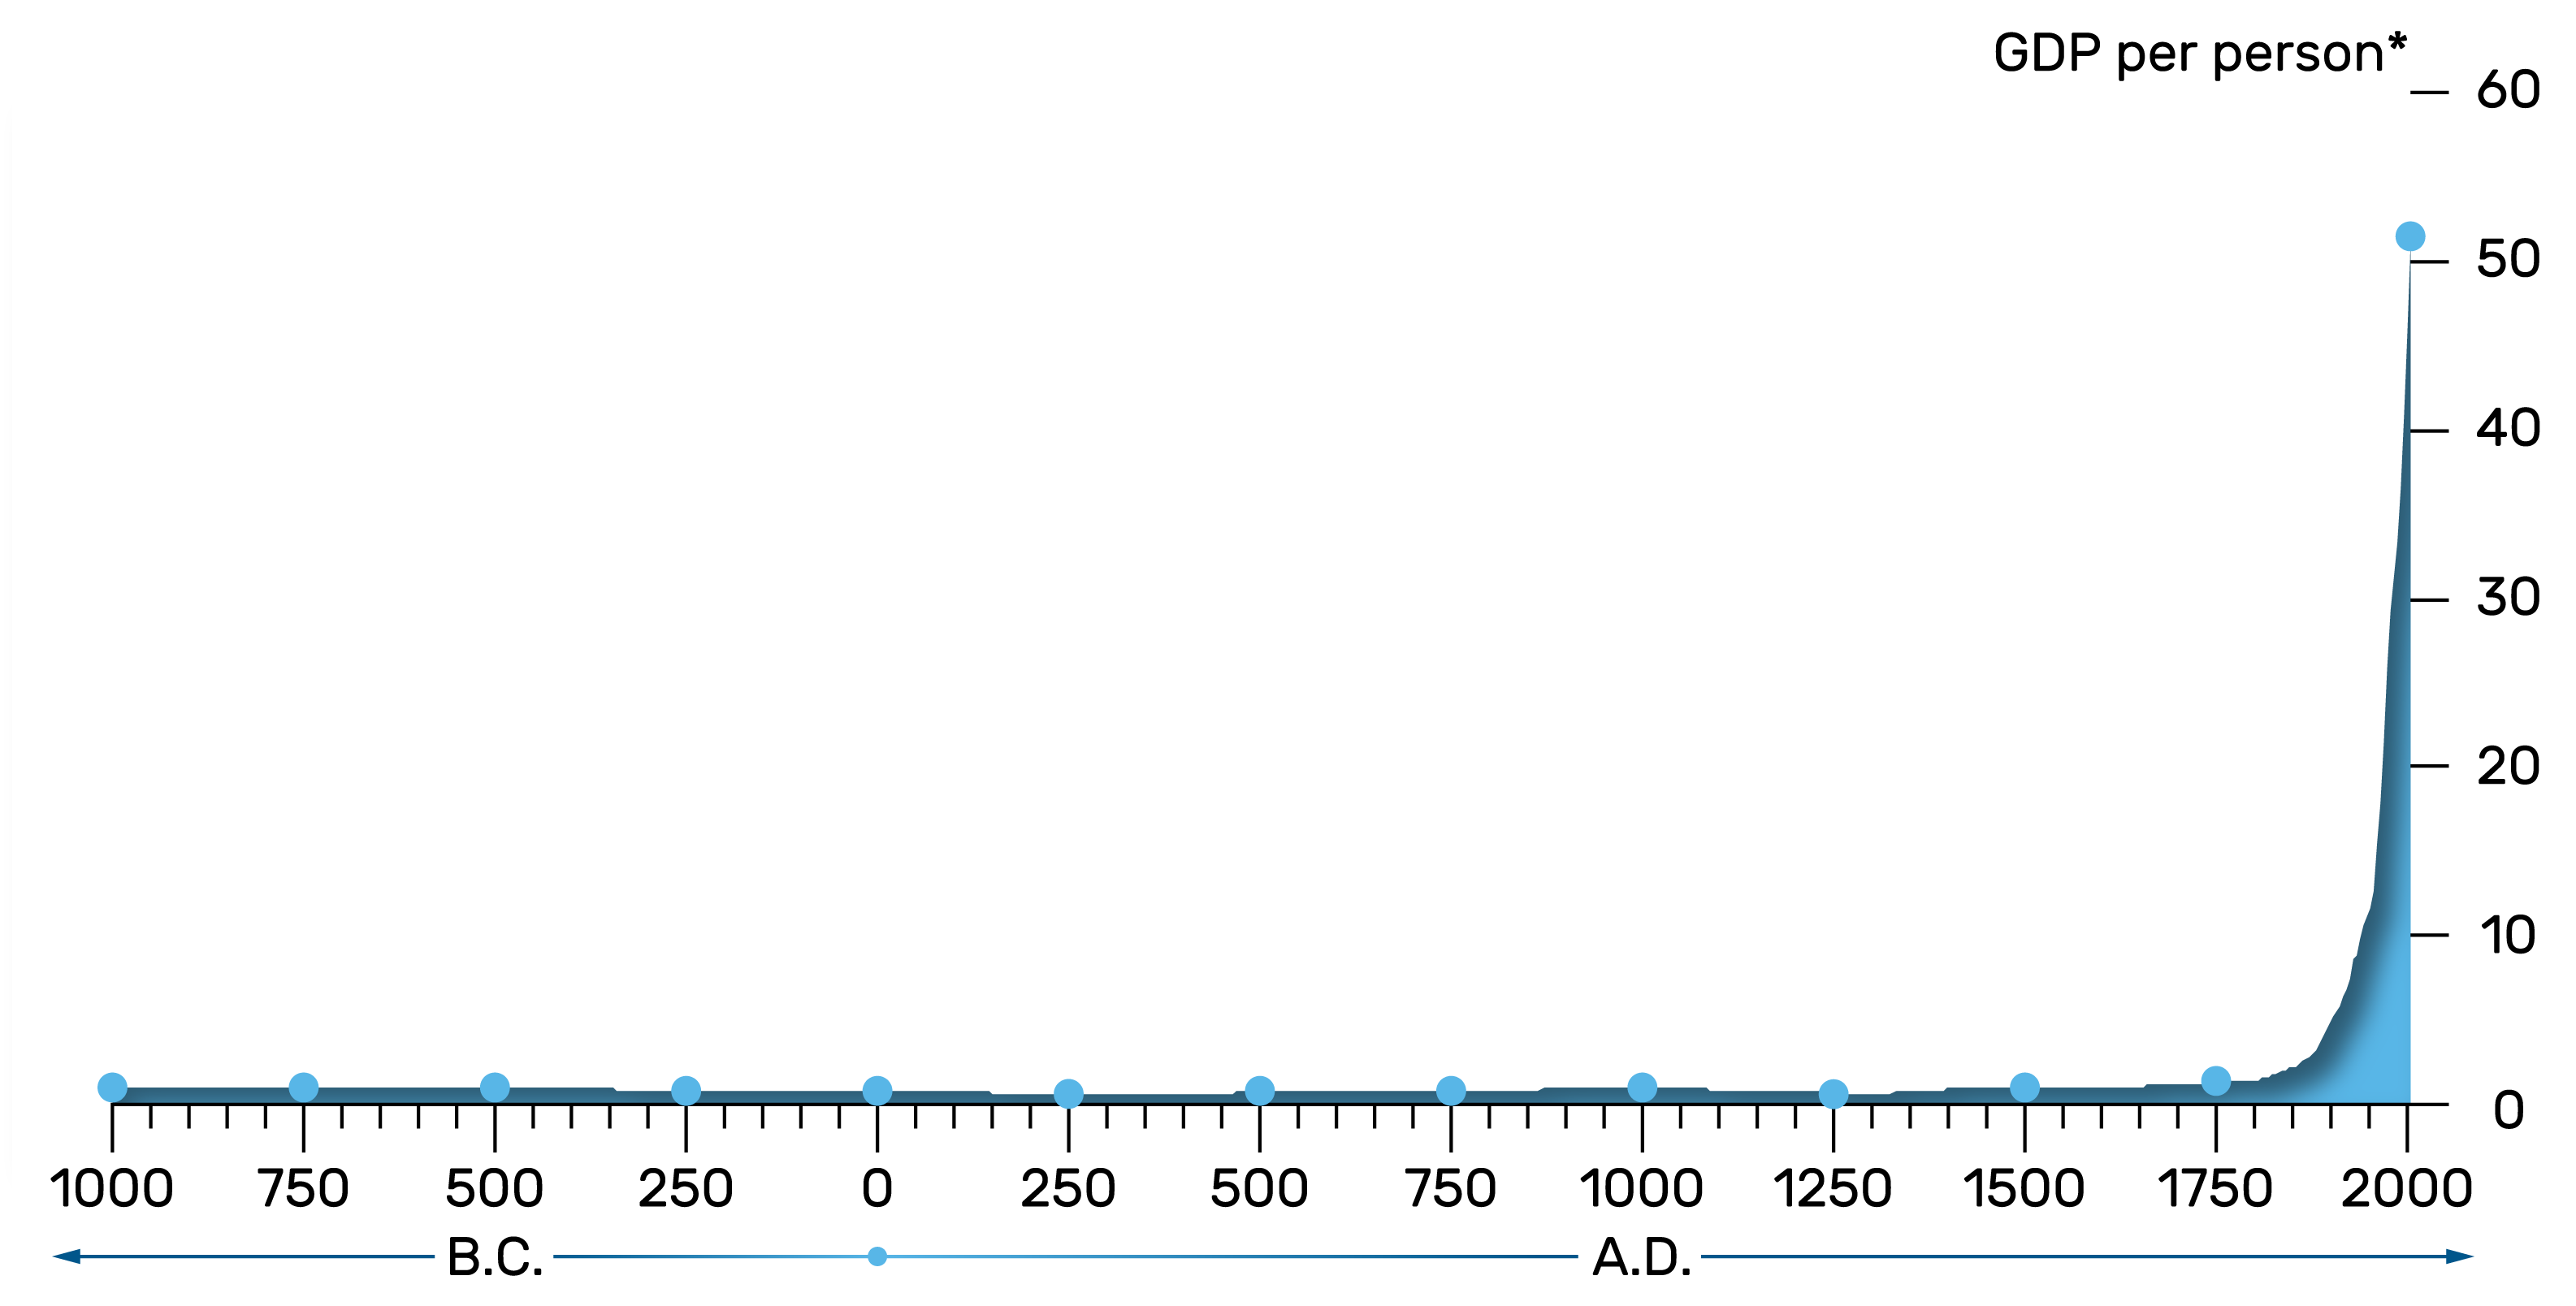
This chart shows estimates of global GDP per person going back to 1,000 BC. It suggests that all the way up until 1750, for nearly 3,000 years, economic growth averaged only 0.01% per year. In other words, global living standards were essentially flat.
Source: Data from DeLong (1998). See also the links at the end of this guide.
The chart shows GDP per person (worldwide) relative to the year 1,000 BC. So by the year 2000, for instance, it shows that GDP per person was more than 50 times greater than three millennia before.
How quickly has the world economy grown since 1750?
So what changed in 1750?
Around that time saw the dawn of the Industrial Revolution. Since this point in time, the world economy has expanded for nearly the entire time.
Of course, growth has not been constant. History has been marked with wars, depressions and financial crises, causing growth to stall – and sometimes to fall. And growth has not been even across countries or across individuals within a country.
But on average, GDP growth per person since 1750 has been 1.5% per year.
This means that each generation has been around a third better off than the one before it, on average.
That’s a massive contrast with the earlier period of history. One way to see this is to compare how long it takes for the economy to double in size in each of these two periods. Between 1750 and now, based on the average growth rates, this would take around 50 years. Before 1750, it would have taken 6,000 years for the economy to double in size!
Which inventions have driven GDP growth since 1750?
History suggests there have been three main phases of innovation that have lifted economic fortunes.
The Industrial Revolution, which started in the middle of the 18th century, saw the invention of the steam engine, cotton spinning and railways. Next, around a century later, was the era of mass industrialisation, with rising use of electricity and indoor water supply. Then we had the IT revolution – starting in the second half of the 20th century. This gave us, among other things, personal computers and the internet.
The Industrial Revolution (around 1750-1830)
The era of mass industrialisation (around 1870-1910)
The IT revolution (around 1950-present)
Each of these phases of innovation gave birth to technologies that have had a big influence well beyond the purpose for which they were originally designed.
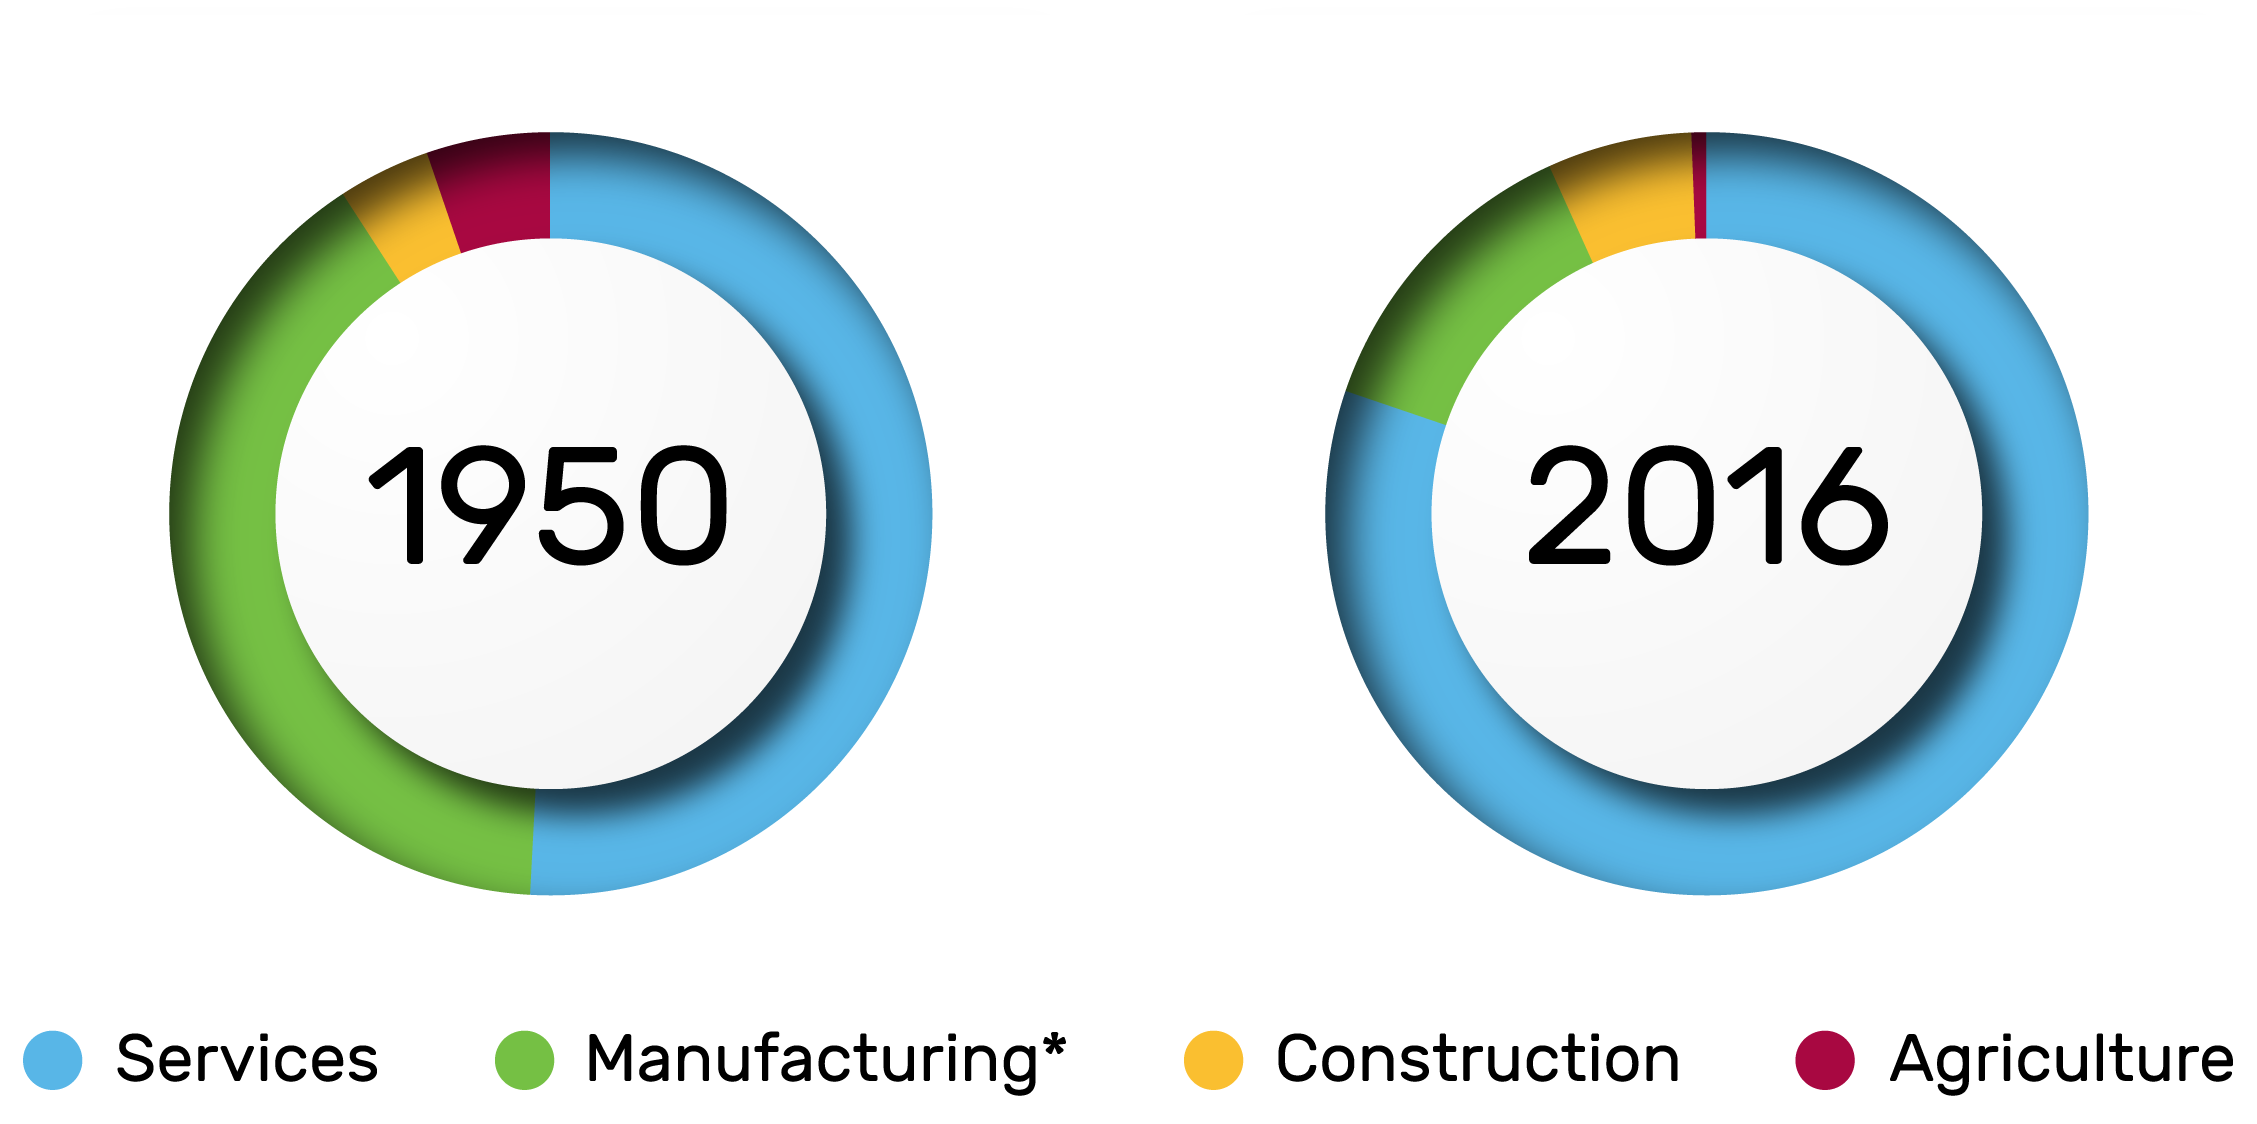
Take, for example, the IT revolution. This transformed business processes across many industries, leading to sweeping changes to the structure of the UK economy. And the result? The ‘service economy’ that we have today. In contrast to physical ‘stuff’ that you might buy, services involve the exchange of money for everything from accounting to advertising.
The charts below show the shift in the UK economy over time. In 1950, services accounted for around 50% of total output in the UK; manufacturing, construction and agriculture made up the rest.
Fast forward to the latest data: services now account for 80% of total output. This means that £8 out of every £10 spent in the UK is on services. Meanwhile, manufacturing has declined as a share in total output from around one third in 1950, to just over 10% today.
The UK economy by sector
What does the future hold for GDP growth?
We produce GDP forecasts to set interest rates and meet our target for low inflation.
However, forecasting GDP growth is difficult. You can find our forecasts, which look ahead to the coming three years, in our Inflation Report.