The Prudential Regulation Authority (PRA) would welcome comments and views on the material set out in this paper.
Comments should be sent by Monday 16 March 2020 to: InsuranceDataRelease@bankofengland.co.uk.
Summary
The Bank of England and Prudential Regulation Authority (PRA) are preparing to publish regular, aggregated data relating to the UK Insurance market on a quarterly basis. We recognise the value of UK Insurance data produced in a timely and structured publication, based on the regular submission of data by Solvency II firms across the various sectors of the market. The purpose of this paper is to inform potential users of such data and the proposed content and presentation, and to invite comment and feedback that may help shape the publication.
The proposed content of the publication represents core insurance statistics, some of which were included in our Insurance Data Release, published in October 2017. The current proposed mapping of statistics is contained within the Contents section below. The manner in which statistics will be provided for users is detailed within the Data Presentation section below.
Subject to any comments and feedback received, we intend to publish the first Insurance Data Release in the new format during the first half of 2020. Comments will also be welcome thereafter.
Rationale
At present, we do not release a regular publication of UK Insurance data externally. We understand that analysis and insights into the UK Insurance market are built upon access to timely, quality data. Through regular disclosure of key insurance statistics, we seek to facilitate the analysis and insight into time-period data, utilising the breadth and depth of data submitted by UK Solvency II undertakings.
Since the implementation of Solvency II, we have emphasised to UK undertakings the need for correct and complete data, and recognise that undertakings have endeavored to comply with plausibility and quality checks. The efforts and improvements by firms to provide good quality data have resulted in the PRA being able to provide aggregated market data for industry users outside of the PRA.
The publication of PRA aggregated insurance statistics will be accompanied with underlying aggregated granular data to enable users to perform bespoke analysis. The content will also seek to incorporate, within the publication, aggregated statistics currently published by the European Insurance and Occupational Pensions Authority (EIOPA), for ease of analysis. We will not comment on the data or seek to provide any explanation of observed trends or movements.
The content of the initial publication will be based on Solvency II Quantitative Reporting Templates (QRTs) and, where relevant, supplemented with PRA data collections.
The schedule for publication will be at a timely point following the submission and quality checking of quarterly and annual data, with the intention of publishing the information when it is of most relevance.
Content
The table below contains a list of the proposed statistics to be published, including the template from which the data is based. The list represents areas of core insurance data that may be expanded upon in future publications. Additional content may extend to other data points, such as those taken from the National Specific Templates (NSTs) and other PRA data collections.
The publication will include the split of Life and Non-Life insurance where relevant. It is indicated within the table below, the areas where multiple templates are used for the statistics, highlighted by square brackets.
As noted, the below list represents core insurance statistics that will form regular publication. We welcome comment and feedback on the scope and depth of the proposed list that may shape the content and how it is presented.
|
Input Quarterly Template |
PRA Publication Statistics |
|
|
S.02 |
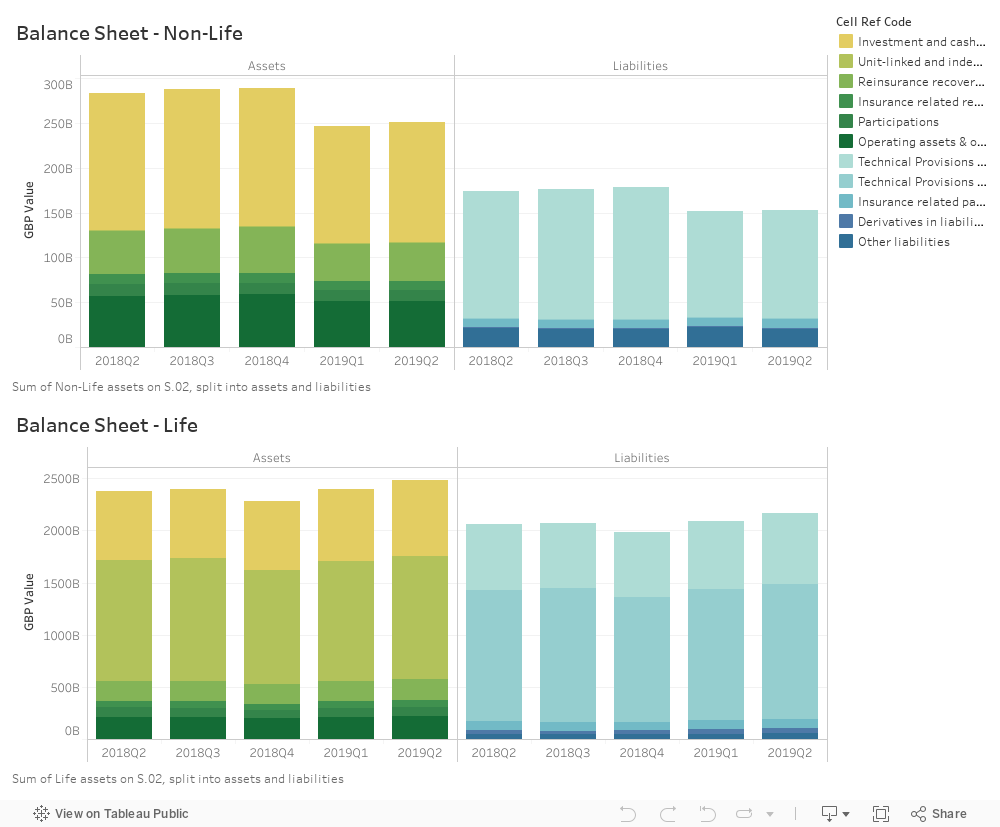
Balance Sheet |
- Breakdown of movements in the balance sheet (movements in assets & liabilities e.g. Investments, Technical Provisions etc.)* |
|
S.05 |
Premium Claim & Expenses |
- [S.28] Performance metrics by line of business (net written premium, net claims loss ratio & combined operating ratio) |
|
S.06 |
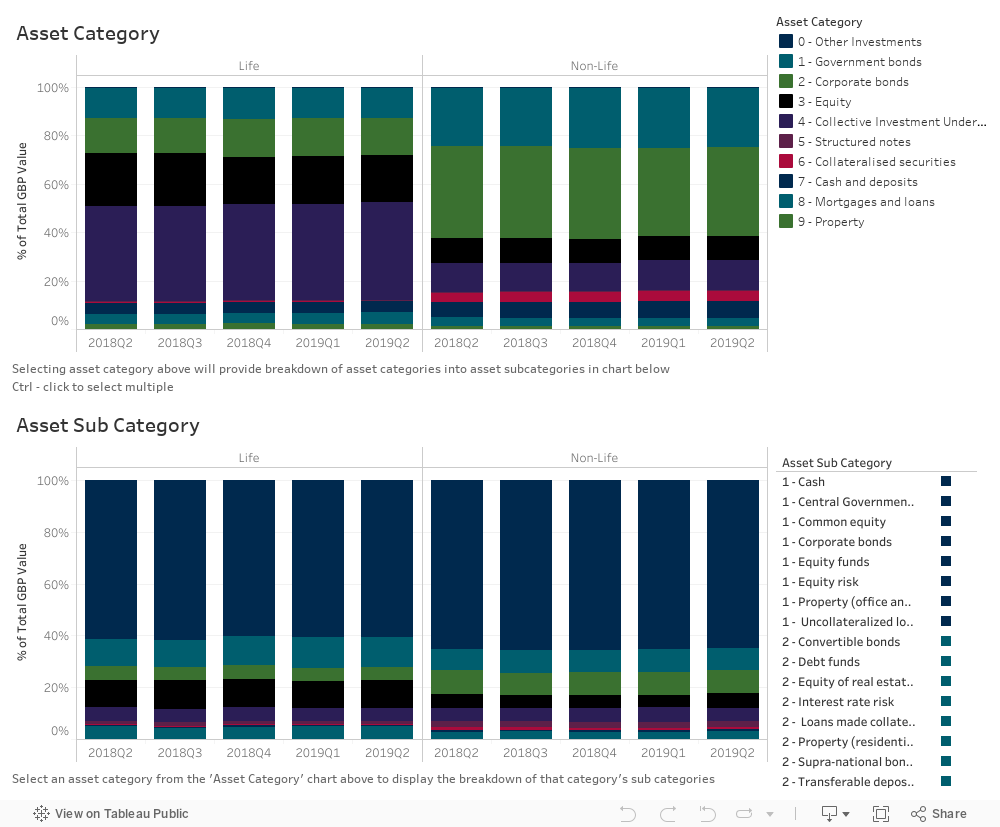
List of Assets |
- Proportion of investments by investment category * |
|
S.12 |
Life & Health SLT Technical Provisions |
- [S.17 & S.23] Capital coverage of the life and non-life insurance sectors over time post-transitional measures for technical provisions (TMTP) |
|
S.17 |
Non-Life Technical Provisions |
- [S.12] Breakdown of the best estimate liabilities into claims provisions and premium provisions, net and gross for key lines of business |
|
S.23 |
Own Funds |
- Average & range of SCR/MCR coverage ratio |
|
S.28 |
Minimal Capital Requirement |
- Items in MCR, net written premium & net best estimate by line of business |
|
Input Annual Template |
PRA Publication Statistics |
|
|
S.05.02 |
Premium Claim & Expenses – by country |
- Net written premiums, net claims ratio and net operating ratio by country |
|
S.12.02 |
Life & Health SLT Tech Provisions – by country |
- Items in technical provisions by country |
|
S.14.01 |
Life obligations analysis |
- Analysis of products and homogenous risk groups |
|
S.17.02 |
Non-Life Technical Provisions – by country |
- Breakdown of technical provisions by line of business by country |
|
S.22.01 |
Impact of LTG measures and transitionals |
- Items in long term guarantees and transitional |
|
S.25.01 |
SCR - for undertakings on Standard Formula |
- Items in breakdown of standard formula SCR |
Data Presentation
In order to maximise the value of the publication, we are looking at methods to enhance user engagement with the data through interactive tables/charts. Development is currently focused on a Tableau based solution to display aggregated data and enable a degree of filtering to facilitate instances of data specific analysis.
The delivery of the Tableau based publication will be hosted within an html file on the Bank of England’s website.
The below links of example data will provide an indication of the format of published statistics that are being developed.