Section 1 – Capital:
For Section 1, data from third country branches have been excluded due to the different capital requirements between third country branches and solo insurance firms.
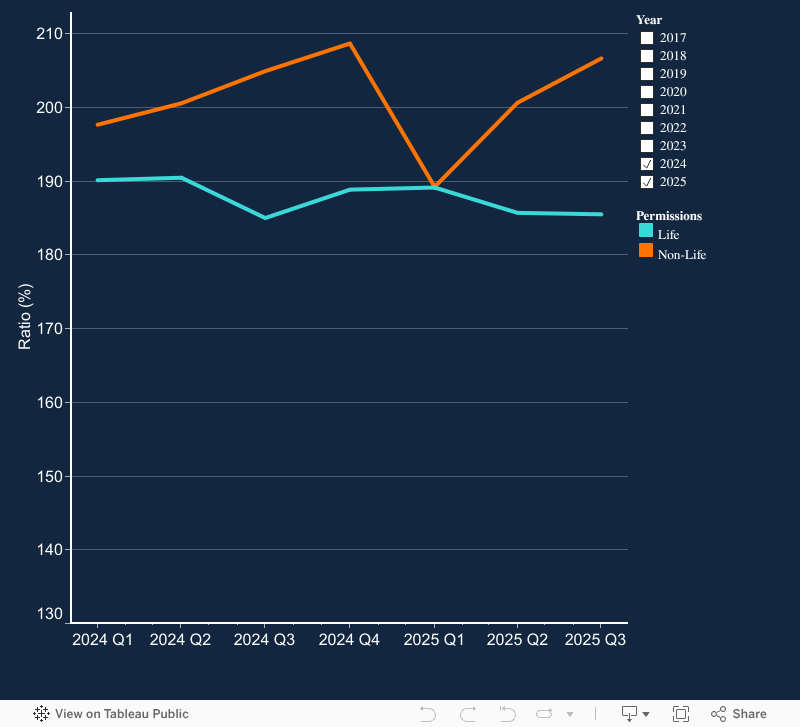
Chart 1.1: Solvency Capital Requirement (SCR) coverage
This chart shows the capital coverage of the life and non-life insurance sectors over time, measured by the ratio of eligible own funds to meet SCR. This is a weighted average calculation:
Capital coverage = (1) / (2)
|
1
|
Total eligible own funds to meet SCR for selected cohort
|
IR.23.01R0540C0010
|
|
2
|
Total SCR for selected cohort
|
IR.23.01R0580C0010
|
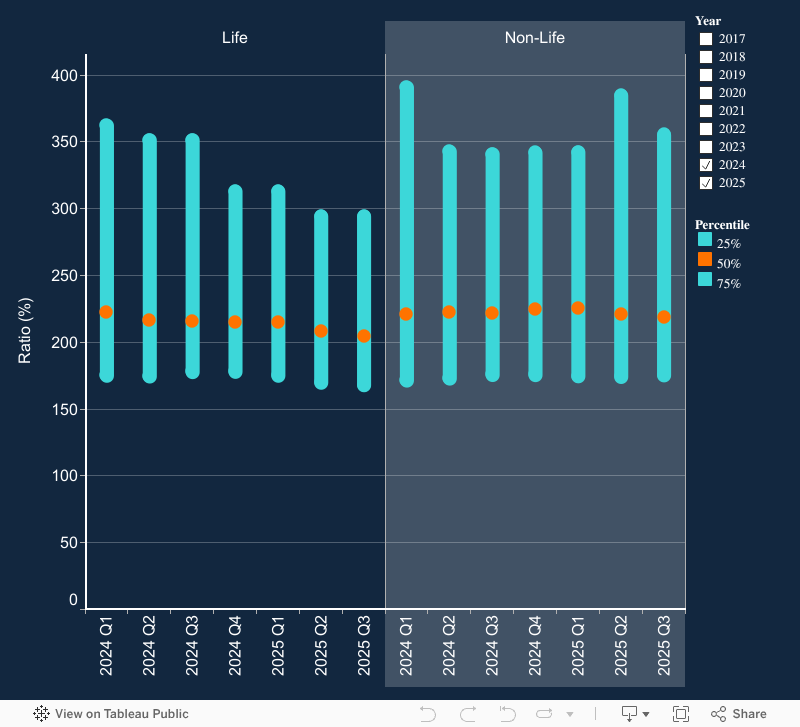
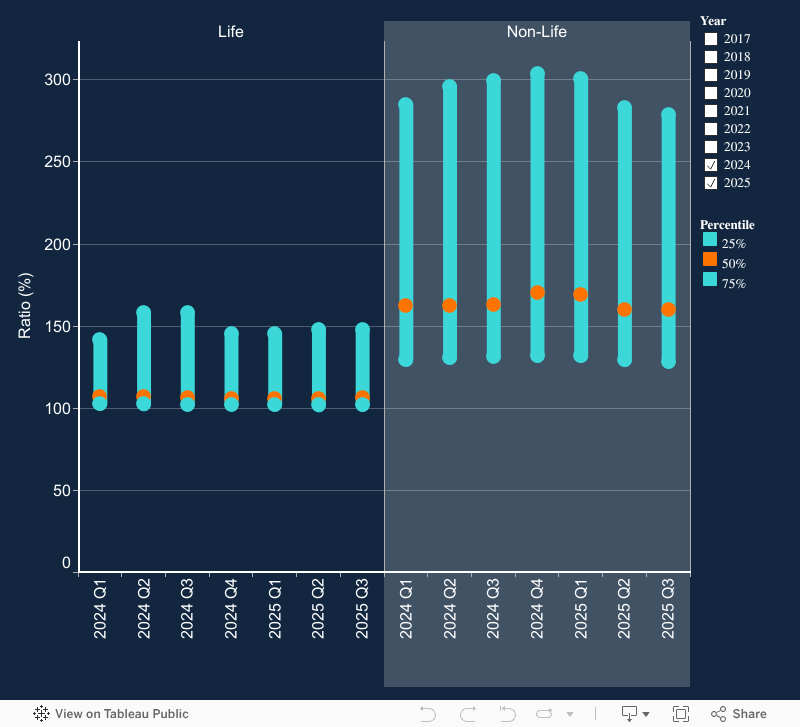
Chart 1.2: Range of SCR coverage ratio
This chart shows the range of SCR coverage ratios in the life and non-life insurance cohorts. The SCR is measured by standard formula, partial internal model or full internal model.
|
1
|
Total eligible own funds to meet SCR for selected cohort
|
IR.23.01R0540C0010
|
|
2
|
Total SCR for selected cohort
|
IR.23.01R0580C0010
|
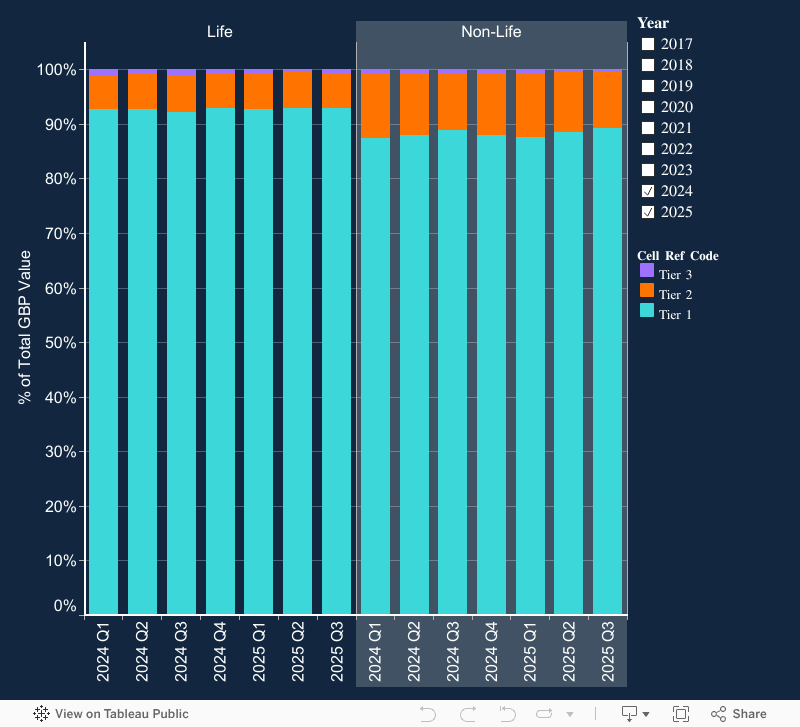
Chart 1.3: Quality of capital
This chart shows the breakdown of the quality of capital for the life and non-life sectors and how it has changed over time. The breakdown is into the relevant tiers reported for eligible own funds.
|
1
|
Total tier 1 eligible own funds to meet SCR for selected cohort
|
IR.23.01R0540C0020 + IR.23.01R0540C0030
|
|
2
|
Total tier 2 eligible own funds to meet SCR for selected cohort
|
IR.23.01R0540C0040
|
|
3
|
Total tier 3 eligible own funds to meet SCR for selected cohort
|
IR.23.01R0540C0050
|
Proportion of tier 1 eligible own funds to meet SCR = (1) / (1 + 2 + 3)
Proportion of tier 2 eligible own funds to meet SCR = (2) / (1 + 2 + 3)
Proportion of tier 3 eligible own funds to meet SCR = (3) / (1 + 2 + 3)
Section 2 – Balance Sheet:
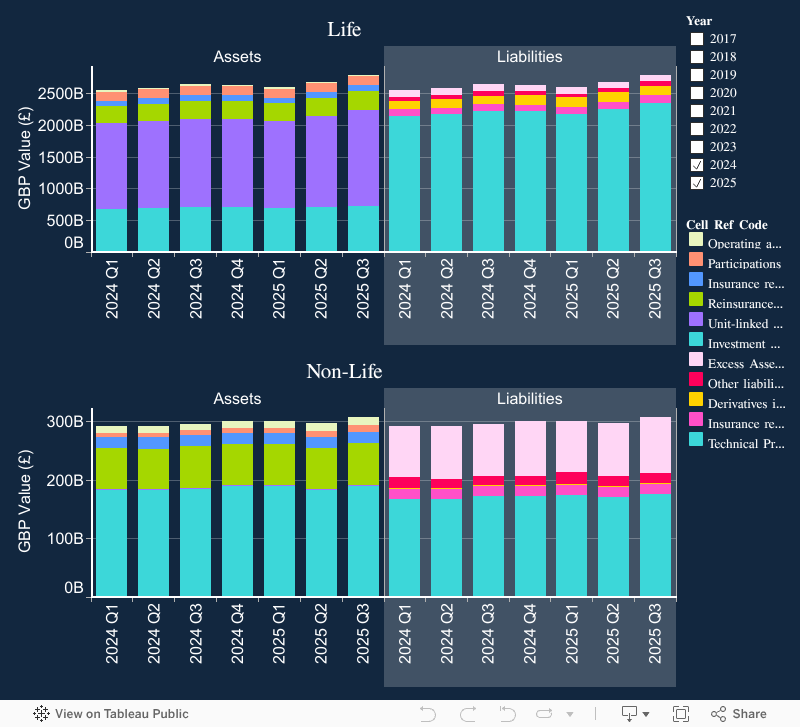
Chart 2.1: Balance Sheet
This chart breaks down the movement in assets and liabilities.
Assets:
|
1
|
Investments and cash excluding participations
|
IR.02.01R0070C0010 - IR.02.01R0090C0010 + IR.02.01R0230C0010 + IR.02.01R0410C0010
|
|
2
|
Unit-linked and index-linked assets
|
IR.02.01R0220C0010
|
|
3
|
Reinsurance recoverables
|
IR.02.01R0270C0010
|
|
4
|
Insurance related payables
|
IR.02.01R0350C0010 + IR.02.01R0360C0010 + IR.02.01R0370C0010
|
|
5
|
Participations
|
IR.02.01R0090C0010
|
|
6
|
Operating assets & other
|
IR.02.01R0500C0010 - (IR.02.01R0070C0010 + IR.02.01R0230C0010 + IR.02.01R0410C0010 + IR.02.01R0270C0010 + IR.02.01R0350C0010 + IR.02.01R0360C0010 + IR.02.01R0370C0010)
|
Liabilities:
|
7
|
Technical Provisions
|
IR.02.01R0505C0010
|
|
8
|
Insurance related payables
|
IR.02.01R0770C0010 + IR.02.01R0820C0010 + IR.02.01R0830C0010
|
|
9
|
Derivatives in liabilities
|
IR.02.01R0790C0010
|
|
10
|
Other liabilities
|
IR.02.01R0900C0010 - (IR.02.01R0505C0010 + IR.02.01R0770C0010 + IR.02.01R0820C0010 + IR.02.01R0830C0010 + IR.02.01R0790C0010)
|
|
11
|
Excess Assets over Liabilities |
IR.02.01R1000C0010
|
Chart 2.2: Average and range of the ratio of assets to liabilities
This chart shows the average and range over time of the asset-liability ratio. It excludes unit linked and index linked assets and unit linked and index linked technical provisions. The range box shows the 25th, 50th and 75th percentiles of capital coverage for the selected cohort.
Asset-liability ratio = Total assets / Total liabilities
|
1
|
Total assets for selected cohort
|
IR.02.01R0500C0010
|
|
2
|
Total liabilities for selected cohort
|
IR.02.01R0900C0010
|
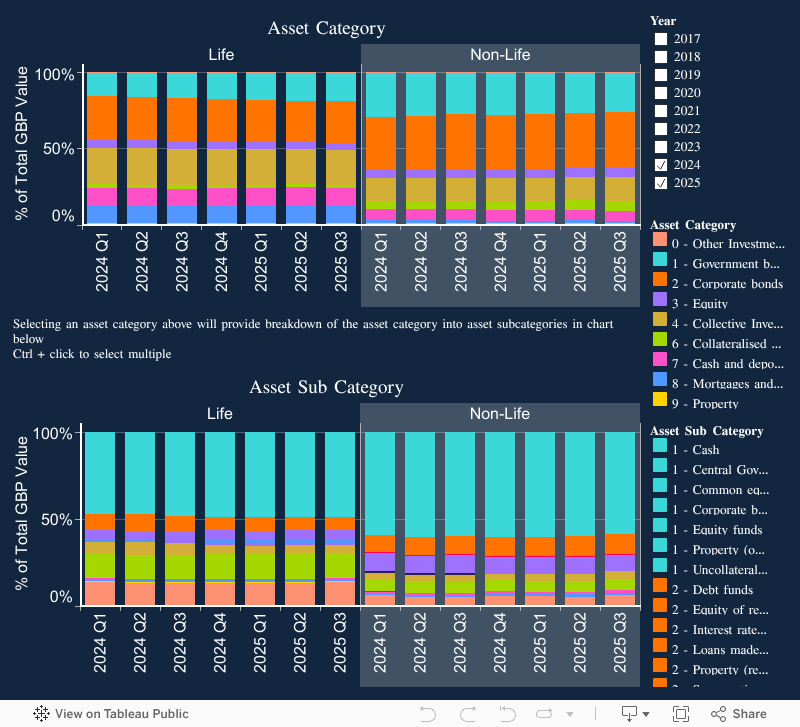
Section 3 - Assets:
These charts show various breakdowns of assets and bonds based on the granular asset data set, which has been subject to some data cleansing. The information is based on the item-by-item asset data submitted in IR.06.02.
Chart 3.1 – Chart 3.3: Breakdowns of assets and bonds
This chart shows the proportion of each type of asset. Some combining of categories has been necessary to ensure confidentiality of individual firm data.
Chart 3.2: Breakdown of bonds by credit rating
This chart shows the proportion of bonds with each credit rating. The reported data been subject to some data cleansing, as not all firms report ratings in the format shown in the chart. The chart includes both government and corporate bonds.
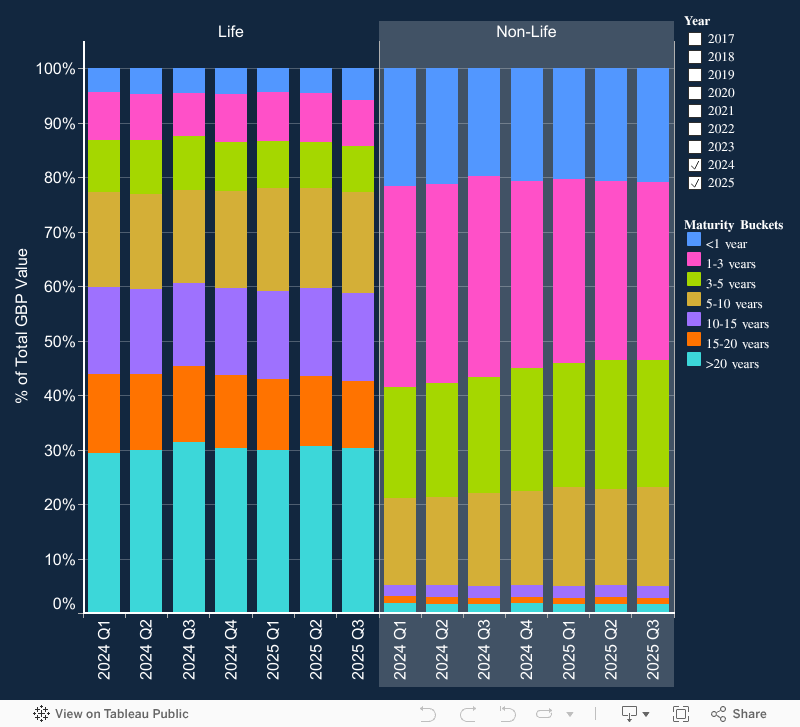
Chart 3.3: Breakdown of bonds by years to maturity
This chart shows the proportion of bonds that fall into each duration bucket. The reported data has been subject to some data cleansing in order to derive years to maturity from the maturity date.
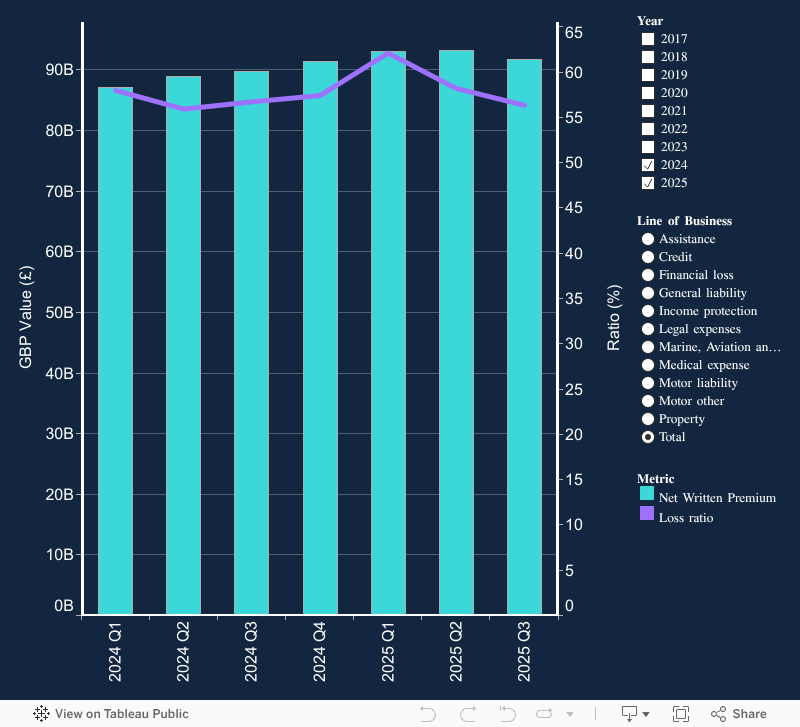
Section 4 – Non-Life Lines of Business:
Chart 4.1: Performance metrics for key lines of business (Non-life sector)
This chart shows performance metrics over time for all lines of business. It shows net written premiums in the last 12 months. It also shows the net incurred claims loss ratio.
|
Cohort
|
Net written premiums in last 12 months
|
Net claims incurred - Year to date
|
Net earned premiums - Year to date
|
|
Assistance
|
IR.05.04R0160C0250
|
IR.05.04R0690C0250
|
IR.05.04R0220C0250
|
|
Credit & Suretyship
|
IR.05.04R0160C0230
|
IR.05.04R0690C0230
|
IR.05.04R0220C0230
|
|
Financial loss
|
IR.05.04R0160C0260
|
IR.05.04R0690C0260
|
IR.05.04R0220C0260
|
|
General liability (including Workers’ compensation)
|
IR.05.04R0160C0130 + IR.05.04R0160C0190 + IR.05.04R0160C0200 + IR.05.04R0160C0210 + IR.05.04R0160C0220
|
IR.05.04R0690C0130 + IR.05.04R0690C0190 + IR.05.04R0690C0200 + IR.05.04R0690C0210 + IR.05.04R0690C0220
|
IR.05.04R0220C0130 + IR.05.04R0220C0190 + IR.05.04R0220C0200 + IR.05.04R0220C0210 + IR.05.04R0220C0220
|
|
Income protection
|
IR.05.04R0160C0120
|
IR.05.04R0690C0120
|
IR.05.04R0220C0120
|
|
Legal expenses
|
IR.05.04R0160C0240
|
IR.05.04R0690C0240
|
IR.05.04R0220C0240
|
|
Marine, aviation & transport
|
IR.05.04R0160C0160
|
IR.05.04R0690C0160
|
IR.05.04R0220C0160
|
|
Medical expenses
|
IR.05.04R0160C0110
|
IR.05.04R0690C0110
|
IR.05.04R0220C0110
|
|
Motor vehicle liability
|
IR.05.04R0160C0140 + IR.05.04R0160C0141
|
IR.05.04R0690C0140 + IR.05.04R0690C0141
|
IR.05.04R0220C0140 + IR.05.04R0220C0141
|
|
Motor vehicle other
|
IR.05.04R0160C0150 + IR.05.04R0160C0151
|
IR.05.04R0690C0150 + IR.05.04R0690C0151
|
IR.05.04R0220C0150 + IR.05.04R0220C0151
|
|
Property
|
IR.05.04R0160C0170 + IR.05.04R0160C0180
|
IR.05.04R0690C0170 + IR.05.04R0690C0180
|
IR.05.04R0220C0170 + IR.05.04R0220C0180
|
|
Total non-life
|
IR.05.04R0160C0015
|
IR.05.04R0690C0015
|
IR.05.04R0220C0015
|
Loss ratio = Net claims incurred / Net earned premiums
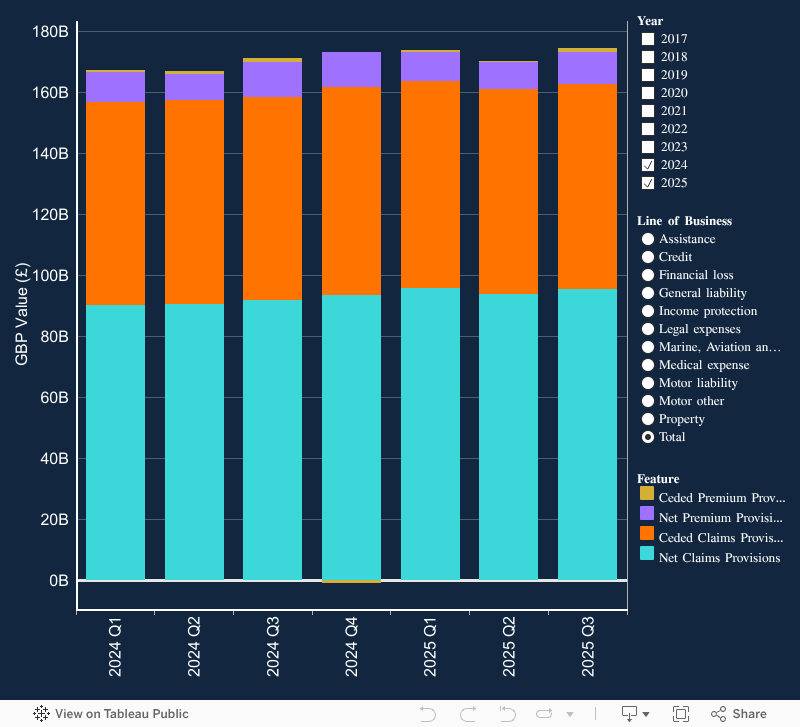
Chart 4.2: Best estimate liabilities breakdown for key lines of business
This chart shows the breakdown of the best estimate liabilities into claims provisions and premium provisions, for all direct and proportional reinsurance lines of business.
(Ceded provisions are after the adjustment for expected losses due to counterparty default.)
| Cohort
|
Net claims provisions
|
Ceded claims provisions
|
Net premium provisions
|
Ceded premium provisions
|
| Assistance |
IR.17.01R0250C0120 |
IR.17.01R0240C0120 |
IR.17.01R0150C0120 |
IR.17.01R0140C0120 |
| Credit & Suretyship |
IR.17.01R0250C0100 |
IR.17.01R0240C0100 |
IR.17.01R0150C0100 |
IR.17.01R0140C0100 |
| Financial loss |
IR.17.01R0250C0130 |
IR.17.01R0240C0130 |
IR.17.01R0150C0130 |
IR.17.01R0140C0130 |
| General liability (including Workers’ compensation) |
IR.17.01R0250C0040 + IR.17.01R0250C0090 |
IR.17.01R0240C0040 + IR.17.01R0240C0090 |
IR.17.01R0150C0040 + IR.17.01R0150C0090 |
IR.17.01R0140C0040 + IR.17.01R0140C0090 |
| Income protection |
IR.17.01R0250C0030 |
IR.17.01R0240C0030 |
IR.17.01R0150C0030 |
IR.17.01R0140C0030 |
| Legal expenses |
IR.17.01R0250C0110 |
IR.17.01R0240C0110 |
IR.17.01R0150C0110 |
IR.17.01R0140C0110 |
| Marine, aviation & transport |
IR.17.01R0250C0070 |
IR.17.01R0240C0070 |
IR.17.01R0150C0070 |
IR.17.01R0140C0070 |
| Medical expenses |
IR.17.01R0250C0020 |
IR.17.01R0240C0020 |
IR.17.01R0150C0020 |
IR.17.01R0140C0020 |
| Motor vehicle liability |
IR.17.01R0250C0050 |
IR.17.01R0240C0050 |
IR.17.01R0150C0050 |
IR.17.01R0140C0050 |
| Motor vehicle other |
IR.17.01R0250C0060 |
IR.17.01R0240C0060 |
IR.17.01R0150C0060 |
IR.17.01R0140C0060 |
| Property |
IR.17.01R0250C0080 |
IR.17.01R0240C0080 |
IR.17.01R0150C0080 |
IR.17.01R0140C0080 |
| Total non-life |
IR.17.01R0250C0180 |
IR.17.01R0240C0180 |
IR.17.01R0150C0180 |
IR.17.01R0140C0180 |
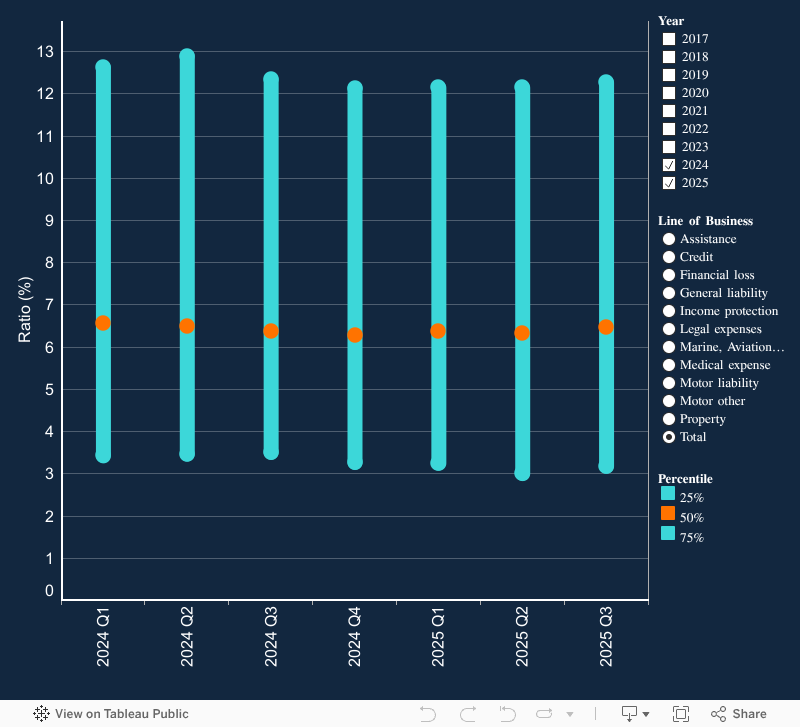
Chart 4.3: Range of risk margin to net best estimate liabilities for key lines of business
This chart shows the range of the ratio of risk margin to net best estimate liabilities. The average is the weighted average for the line. The range box shows the 25th, 50th and 75th percentiles of risk margin to net best estimate liabilities for the line.
| Cohort
|
Risk margin
|
Net best estimate
|
| Assistance |
IR.17.01R0280C0120 |
IR.17.01R0270C0120 |
| Credit & surety |
IR.17.01R0280C0100 |
IR.17.01R0270C0100 |
| Financial loss |
IR.17.01R0280C0130 |
IR.17.01R0270C0130 |
| General liability (including Workers’ compensation) |
IR.17.01R0280C0040 + IR.17.01R0280C0090 |
IR.17.01R0270C0040 + IR.17.01R0270C0090 |
| Income protection |
IR.17.01R0280C0030 |
IR.17.01R0270C0030 |
| Legal expenses |
IR.17.01R0280C0110 |
IR.17.01R0270C0110 |
| Marine, aviation & transport |
IR.17.01R0280C0070 |
IR.17.01R0270C0070 |
| Medical expenses |
IR.17.01R0280C0020 |
IR.17.01R0270C0020 |
| Motor vehicle liability |
IR.17.01R0280C0050 |
IR.17.01R0270C0050 |
| Motor vehicle other |
IR.17.01R0280C0060 |
IR.17.01R0270C0060 |
| Property |
IR.17.01R0280C0080 |
IR.17.01R0270C0080 |
| Total non-life |
IR.17.01R0280C0180 |
IR.17.01R0270C0180 |
Ratio = Risk margin / net best estimate liabilities