Key findings
- The outstanding value of all residential mortgage loans increased by 0.8% from the previous quarter to £1,760.6 billion, and was 3.1% higher than a year earlier (Table A).1
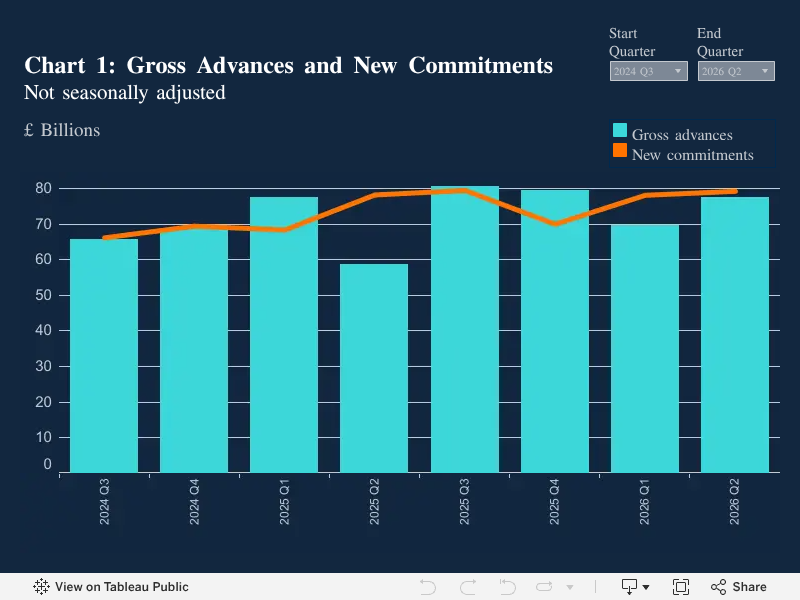
- The value of gross mortgage advances increased by 11.1% from the previous quarter to £77.4 billion, and was 31.7% higher than a year earlier (Table A and Chart 1).
- The value of new mortgage commitments increased by 1.4% from the previous quarter to £79.2 billion, and was 1.3% higher than a year earlier (Table A and Chart 1).
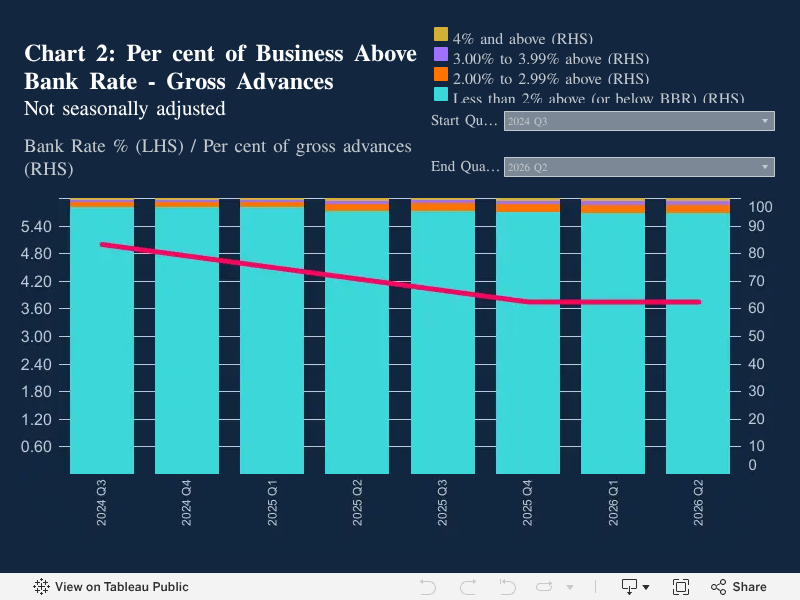
- The share of gross mortgage advances with interest rates less than 2% above Bank Rate decreased by 0.2 percentage points (pp) from the previous quarter to 94.5%, the lowest since 2023 Q1, and was 0.6pp lower than a year earlier (Chart 2).
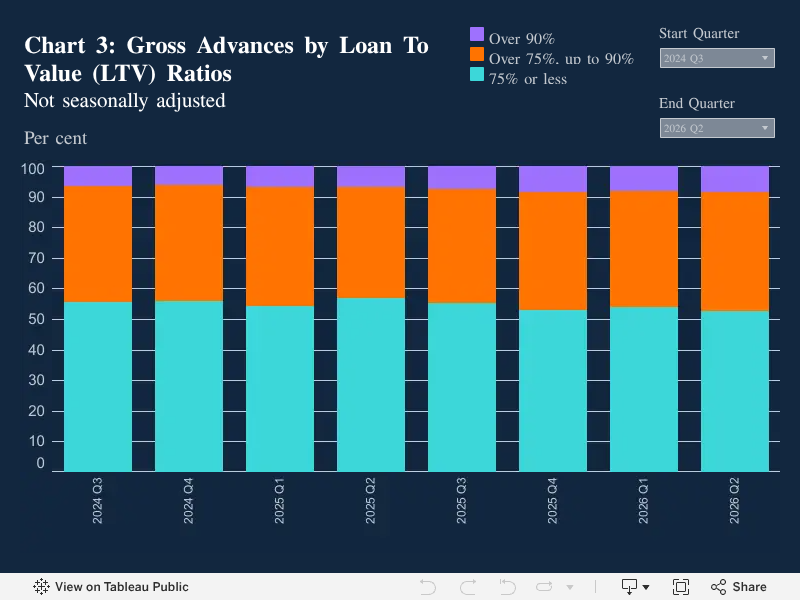
- The share of gross mortgage advances with loan-to-value (LTV) ratios exceeding 90% increased by 0.4pp from the previous quarter to 8.4%, the highest share since 2008 Q2, and was 1.4pp higher than a year earlier (Chart 3).
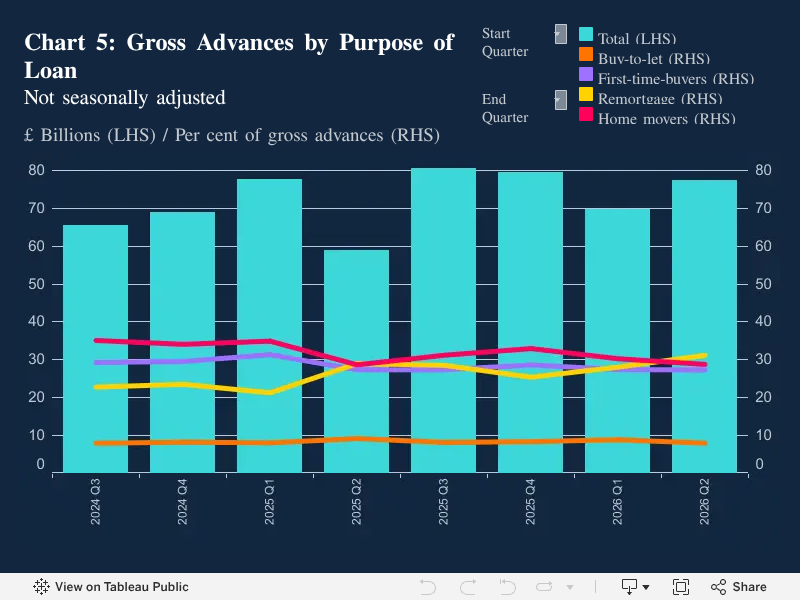
- The share of gross mortgage advances for buy-to-let purposes decreased by 0.9pp from the previous quarter to 8.0%, the lowest since 2024 Q3, and was 1.2pp lower than a year earlier (Chart 5).
- The share of gross mortgage advances for house purchase for owner occupation decreased by 1.6pp from the previous quarter to 56.1%, but remained 0.1pp higher than a year earlier (Chart 5).
- The share of gross advances for remortgages for owner occupation increased by 3.1pp from the previous quarter to 31.2%, the highest since 2024 Q1, and was 2.2pp higher than a year earlier (Chart 5).
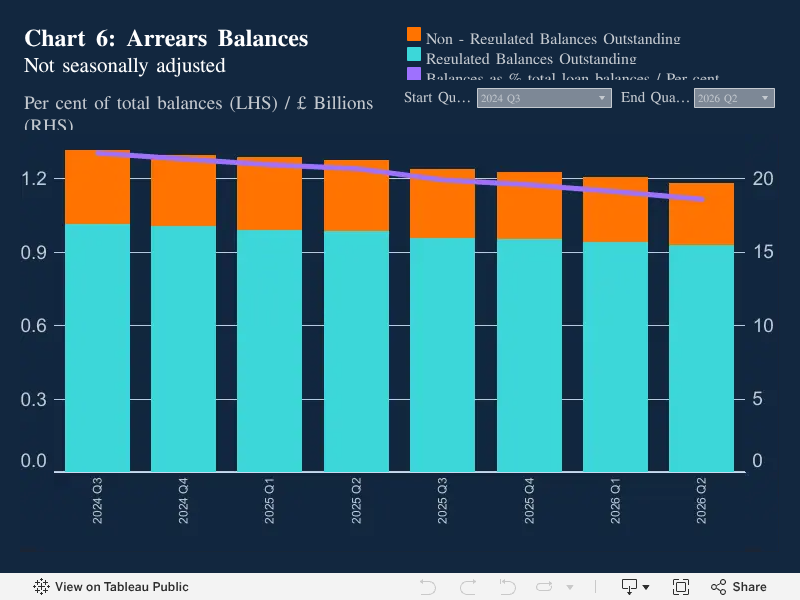
- The value of outstanding mortgage balances with arrears decreased by 1.9% from the previous quarter to £19.7 billion, the lowest since 2023 Q3, and was 7.3% lower than a year earlier (Chart 6).
- The proportion of total mortgage loan balances with arrears, relative to all outstanding mortgage balances, remained unchanged from the previous quarter at 1.1%, and was 0.1pp lower than a year earlier (Chart 6).
Table A: Residential loans to individuals, flows and balances
Regulated and non-regulated mortgages *
£ billions
Not seasonally adjusted
|
Q3 |
Q4 |
Q1 |
Q2 |
Q3 |
Q4 |
Q1 |
Q2 |
|
|
2024 |
2025 |
2026 |
||||||
|
Flows |
||||||||
|
Gross advances |
65.5 |
68.8 |
77.6 |
58.8 |
80.4 |
79.4 |
69.6 |
77.4 |
|
New commitments |
66.1 |
69.4 |
68.3 |
78.2 |
79.4 |
69.9 |
78.1 |
79.2 |
|
Amounts outstanding |
1,674.7 |
1,683.4 |
1,702.4 |
1,707.1 |
1,721.3 |
1,734.2 |
1,746.1 |
1,760.6 |
*This data covers regulated mortgage lending, and non-regulated mortgage lending by firms which undertake regulated mortgage lending or administration of regulated mortgages.
Graphical Analysis:
- The value of gross mortgage advances increased by 11.1% from the previous quarter to £77.4 billion, and was 31.7% higher than a year earlier (Table A and Chart 1).2
- The value of new mortgage commitments (lending agreed to be advanced in the coming months) increased by 1.4% from the previous quarter to £79.2 billion, and was 1.3% higher than a year earlier.3