Mortgage Lenders and Administrators Statistics: 2022 Q2
Key findings
- The outstanding value of all residential mortgage loans was £1,648.0 billion at the end of 2022 Q2, 3.8% higher than a year earlier (Table A). footnote [1]
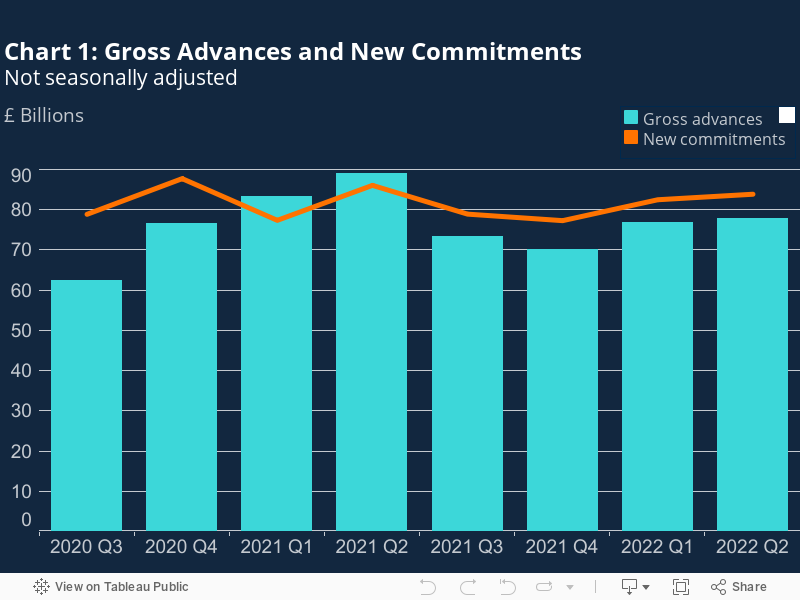
- The value of gross mortgage advances in 2022 Q2 was £77.9 billion, which was £1.0 billion greater than the previous quarter, but 12.6% lower than in 2021 Q2 (Table A and Chart 1).
- The value of new mortgage commitments (lending agreed to be advanced in the coming months) in 2022 Q2 was 1.7% greater than the previous quarter but 2.6% less than a year earlier, at £83.9 billion (Table A and Chart 1).
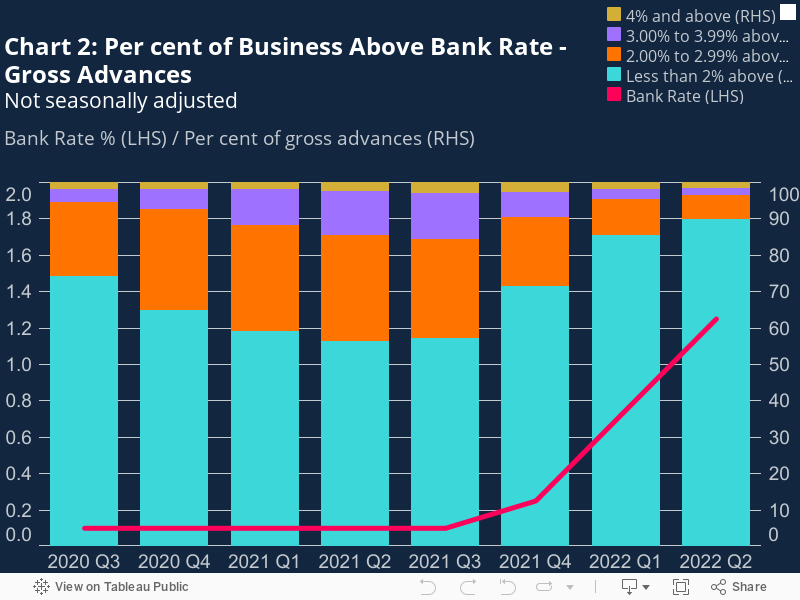
- The share of gross advances with interest rates less than 2% above Bank Rate was 89.9% in 2022 Q2, 33.7 percentage points (pp) higher than a year ago, and the highest seen since 2008 Q3. The increase was mostly driven by the 50bp increase in Bank Rate across the quarter, rather than any significant change in mortgage interest rates (Chart 2). footnote [2]
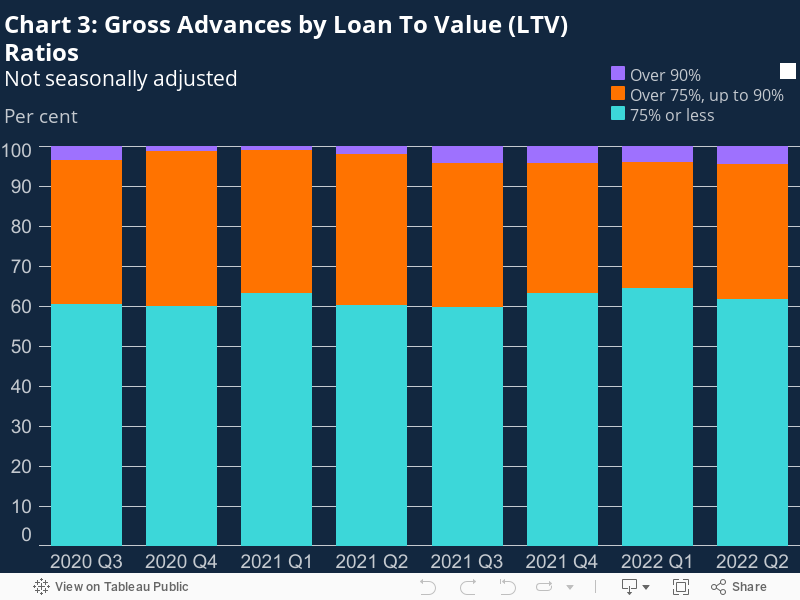
- The share of mortgages advanced in 2022 Q2 with loan to value (LTV) ratios exceeding 90% was 4.5%, 2.4pp higher than a year earlier and the highest seen since 2020 Q2 (Chart 3).
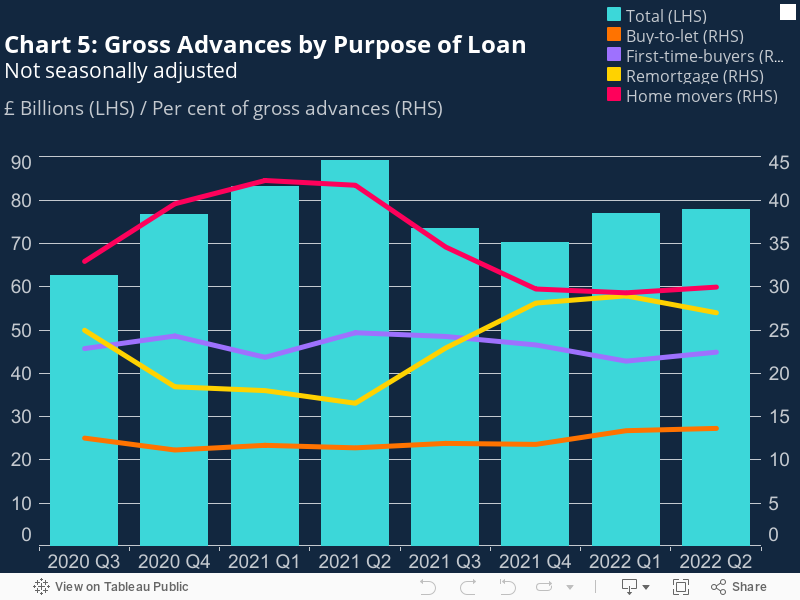
- The share for house purchase for owner occupation was 52.4%, up 1.7pp on the previous quarter, but down 14.0pp from 2021 Q2. The share of gross advances for remortgages for owner occupation was 27.0%, an increase of 10.5pp since 2021 Q2, but a decrease of 2.0pp since 2022 Q1 (Chart 5).
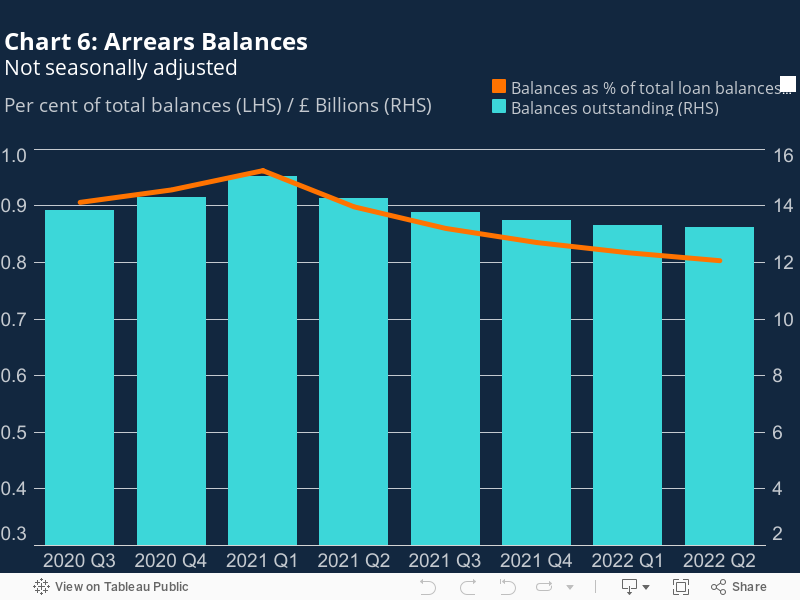
- The value of outstanding balances with arrears decreased by 0.7% over the quarter and 7.2% over the year, to £13.2 billion in 2022 Q2, and now accounts for 0.80% of outstanding mortgage balances, the lowest since recording began in 2007 (Chart 6).
Table A: Residential loans to individuals, flows and balances
Regulated and non-regulated mortgages *
£ billions
|
Q3 |
Q4 |
Q1 |
Q2 |
Q3 |
Q4 |
Q1 |
Q2 |
|
|---|---|---|---|---|---|---|---|---|
|
2020 |
2021 |
2022 |
||||||
|
Flows |
||||||||
|
Gross advances |
62.5 |
76.6 |
83.2 |
89.1 |
73.4 |
70.2 |
76.9 |
77.9 |
|
New commitments |
78.9 |
87.7 |
77.4 |
86.1 |
78.9 |
77.3 |
82.5 |
83.9 |
|
Amounts outstanding |
1,526.0 |
1,541.5 |
1,561.6 |
1,587.4 |
1,601.7 |
1,613.2 |
1,630.3 |
1,648.0 |
Footnotes
Graphical Analysis:
- The value of gross mortgage advances in 2022 Q2 was £77.9 billion, which was £1.0 billion greater than the previous quarter, but 12.6% lower than in 2021 Q2 (Table A and Chart 1). footnote [3]
- The value of new mortgage commitments (lending agreed to be advanced in the coming months) in 2022 Q2 was 1.7% greater than the previous quarter but 2.6% less than a year earlier, at £83.9 billion (Table A and Chart 1). footnote [4]
- The share of gross advances with interest rates less than 2% above Bank Rate was 89.9% in 2022 Q2, 4.4pp higher than last quarter. This was also 33.7pp higher than a year ago, and the highest seen since 2008 Q3. The increase was mostly driven by the 50bp increase in Bank Rate across the quarter, rather than any significant change in mortgage interest rates (Chart 2). footnote [5]
- The share of advances with interest rates between 2% and 3% above Bank Rate decreased over the quarter to 6.6% from 9.8%, while the share of advances with interest rates 3% or more above Bank Rate decreased by 1.2pp to 3.5% from 2022 Q1. footnote [6] footnote [7]
- The share of advances with LTV ratios exceeding 90% increased on the quarter, by 0.5pp, to 4.5% in 2022 Q2. This was 2.4pp higher than a year earlier, and the highest seen since 2020 Q2 (Chart 3). footnote [8] Within this, the share of mortgages advanced with LTVs over 95% was 0.2%, broadly unchanged compared to the previous quarter. footnote [9]
- The share of mortgages advanced in 2022 Q2 with LTV ratios exceeding 75% increased by 2.7pp on the quarter to 38.2%. This is 1.5pp lower than a year earlier. footnote [10]
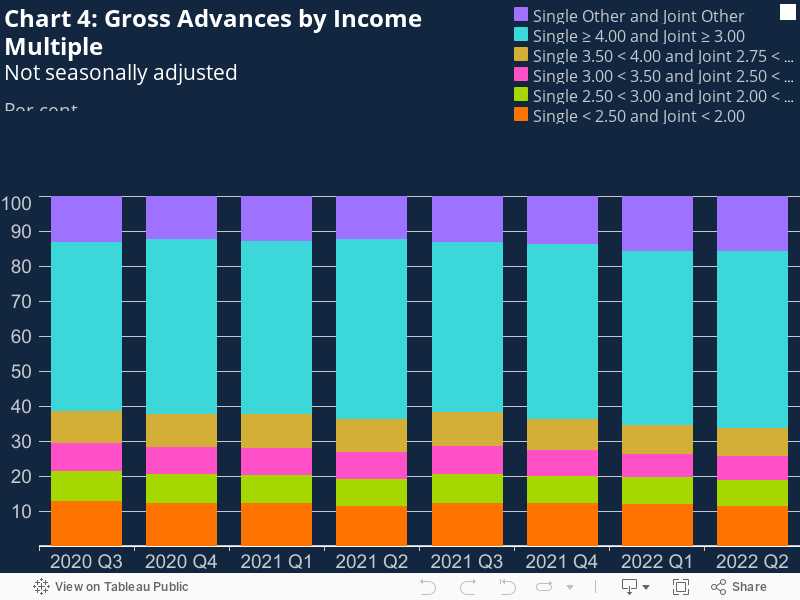
The proportion of lending to borrowers with a high loan to income (LTI) ratio increased by 0.9pp on the quarter to 50.5% in 2022 Q2, but was 0.9pp lower than a year earlier (Chart 4). footnote [11] Borrowers with high LTI are defined here as:
- Borrowers with single income who had a LTI ratio of 4 or above. These loans accounted for 11.3% of gross mortgage lending in 2022 Q2, a 0.5pp decrease compared to the previous quarter. footnote [12]
- Borrowers with a joint income who had a LTI of 3 or above. These loans accounted for 39.2% of gross mortgage lending in 2022 Q2, a 1.4pp increase compared to the previous quarter, and the highest observed since recording began in 2007. footnote [13]
- The share of gross mortgage advances for buy-to-let purposes (covering house purchase, remortgage and further advance) was 13.6% in 2022 Q2, an increase of 2.2pp from 2021 Q2, and the highest seen since 2020 Q2 (Chart 5). The share of advances to owner occupiers was 86.4%. footnote [14] footnote [15]
- Of the 86.4% of advances for owner occupiers, the share for remortgages was 27.0%, an increase of 10.5pp since 2021 Q2, but a decrease of 2.0pp since 2022 Q1. The share for house purchase was 52.4%, up 1.7pp on the previous quarter but down 14.0pp from 2021 Q2. Further advances and other mortgages (including lifetime mortgages) accounted for 6.9% of gross advances in total. footnote [16] footnote [17] footnote [18]
- Of the 52.4% of advances for house purchases by owner occupiers, lending to first-time buyers was 2.2pp lower than in 2021 Q2, at 22.5% of gross advances, but was 1.0pp higher than 2022 Q1. The share advanced to home movers decreased by 11.8pp on a year earlier, to 30.0%, but was 0.7pp higher than 2022 Q1. footnote [19] footnote [20]
- The value of outstanding balances with arrears (defined as the borrower failing to make contractual payments equivalent to at least 1.5% of the outstanding mortgage balance or where the property is in possession) decreased by 0.7% on the quarter and 7.2% on a year earlier, to £13.2 billion, the lowest it has been since recording began in 2007 (Chart 6). footnote [21]
- The proportion of total loan balances with arrears decreased on the quarter from 0.82% to 0.80%, also the lowest since recording began. footnote [22]
-
Table 1.11 sub table A row 9
-
Table 1.21 sub table C row 1
-
Table 1.21 sub table C row 3
-
Table 1.22 sub table C row 3 (less than 2% above)
-
Table 1.22 sub table C row 4 (2.00% to 2.99% above)
-
Table 1.22 sub table C row 5 + row 6 (3% or more above)
-
Table 1.31 sub table C row 19 + row 20
-
100% - Table 1.31 sub table C row 17
-
Table 1.31 sub table C row 20
-
Table 1.31 sub table C row 5 + row 13
-
Table 1.31 sub table C row 5
-
Table 1.31 sub table C row 13
-
Table 1.33 sub table C row 4 (buy-to-let)
-
100% - Table 1.33 sub table C row 4 (owner-occupation)
-
Table 1.33 sub table C row 6 (remortgage)
-
Table 1.33 sub table C row 2 + row 3 (house purchase owner occupation)
-
Table 1.33 sub table C row 5 + row 9 (further advance and other)
-
Table 1.33 sub table C row 2 (first-time buyers)
-
Table 1.33 sub table C row 3 (home movers)
-
Table 1.7 sub table C row 10
-
Table 1.7 sub table C row 11